Corporations are currently producing the highest level of profitability, as a percentage of GDP, in history. However, understanding corporate profitability involves more than glancing at quarterly earnings reports. At its core, the Kalecki Profit Equation provides a valuable framework, especially when exploring the reasons behind today’s elevated profit margins and what could disrupt them.
James Montier discussed the Kalecki profit equation in 2012 in a post entitled “What Goes Up, Must Come Down.” However, that has not been the case, as noted recently by Albert Edwards at Societe Generale:
“Companies have been able to push through profit‑margin‑expanding price increases under the cover of two key events, namely 1) supply constraints in the aftermath of the Covid pandemic and 2) commodity cost-push pressures after Russia’s invasion of Ukraine. But we still emphasise that one of the main sources of the recent surge in profit margins is massive fiscal expansion. In short, the government has been spending more to the benefit of corporates.“
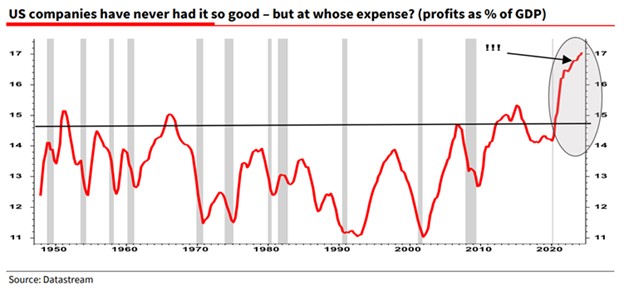
It is that last statement that is most crucial for investors and the incoming Trump administration.
However, we need to understand the Kalecki Profit Equation.
The Kalecki Profit Equation Made Simple
Some economic equations or relations are inspired by guesswork and may not describe the real world precisely. Other equations always hold since they are simple accounting identities. The Kalecki Profit Equation is of the latter type. It describes precisely the factors that determine corporate profits. Knowing this relation can give investors a leg up in predicting earnings.
Named after the economist Michal Kalecki, this equation deciphers the macroeconomic elements that shape business earnings. Corporate profits derive from combining investment, government and household savings behaviors, dividends, and trade flows.
Profits = Investment – Household Saving – Foreign Saving – Government Saving + Dividends
Kalecki’s formula states that net investment, household and government savings, foreign trade balances, and corporate dividend payouts determine total corporate profits. The equation underscores how interconnected economic activities translate into business revenue. For example, when governments run deficits, they inject money into the economy, boosting overall demand and, by extension, corporate earnings. Conversely, business profitability can take a hit when households save more or governments cut spending.
As shown, after a massive spike in household savings during the pandemic, the surge in corporate profitability was unsurprising as households went on a shopping spree.
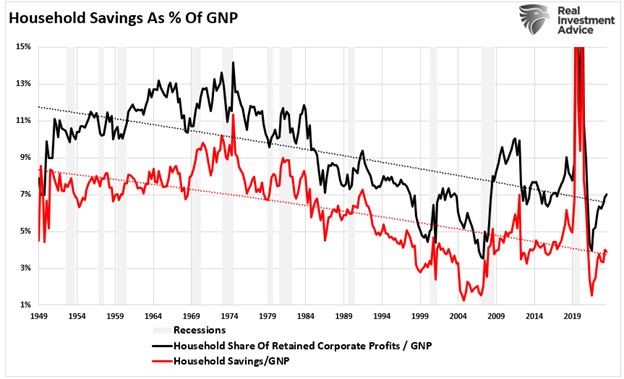
It is crucially important to understand the bolded statement above. Many economists and analysts are raising alarm bells about increasing government spending and deficits. However, over the past decade, record profit margins have become a hallmark of corporate America as politicians continue to “UN-save” by running more significant deficits. Therefore, corporate profit margins have averaged far higher than the historical norm, with both households and the government “dis-saving” at an increasing pace. From the aftermath of the 2008 financial crisis through the pandemic stimulus programs, fiscal policy has kept money flowing and profits robust.
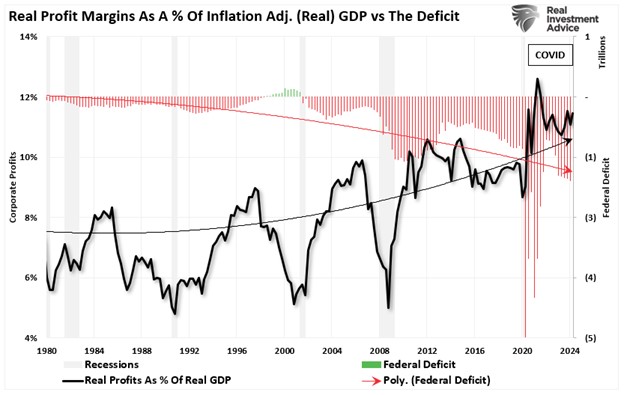
As discussed previously, massive government interventions have kept economic growth humming for the last two decades. While the incoming Trump administration suggests cutting spending and the deficits, the consequences, which are long-term beneficial, will be painful in the short term.
Decoding Today’s Elevated Profit Margins
Government spending isn’t the sole contributor to recent profitability highs. Investment dynamics and changing consumer behavior have played critical roles. The post-pandemic stimulus created a consumption boom, reinforcing corporate earnings. Additionally, low interest rates over the last decade fueled significant business investment and stock buybacks, another source of profit strength. As Montier warns, record corporate profit margins can not last indefinitely.
“If the era of big government is here to stay then profits as a percent of GNP can remain higher than in the past. However, it should be noted that economic theory offers no reason as to why profit margins should mean revert. It is the return on capital, not the return on sales, that ‘should’ mean revert. Of course, because capital is not observable, we are forced to proxy it.
From a simple profit margins perspective, we can examine the Shiller P/E. This measure attempts to smooth out the cyclical elements of profitability by following Ben Graham’s advice to use 10 years of earnings in the denominator of the P/E. This makes it interesting to us in the current context as it automatically builds in the fact that profitability has been higher over the last 10 years.
So even if one believes that fiscal deficits are here to stay and that profitability is structurally higher as a result, the U.S. market is still trading at around 35x. This dooms investors to low long-run returns. Even if we don’t get any valuation or margin mean reversion, investors are facing a return of around 3% real – hardly likely to be sufficient recompense for the risk of owning equities.”
Since the “Financial Crisis,” massive Government spending has corresponded to a persistently elevated market valuation multiple.
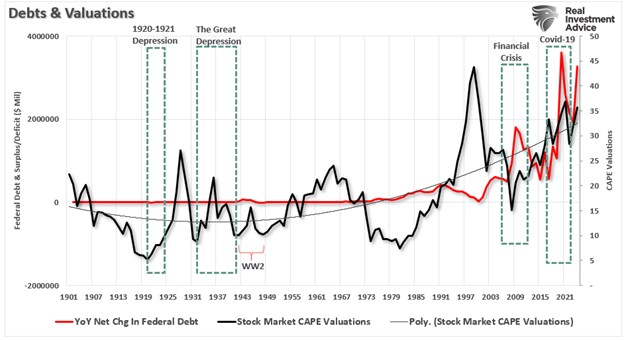
Another anomaly caused by the massive surge in Government and Household spending (dis-saving) has been the detachment of margin-adjusted valuations from earnings-driven valuation measures. As Montier noted in his research:
“In the past both John Hussman and I have shown that various measures of margin-adjusted CAPE have performed better than standard CAPE as predictors of returns – naturally due to the mean reversion of margins over time. They show how if margins were to revert to their ‘normal/historical levels,’ then the CAPE
would be much higher than the standard CAPE shows – margin-adjusted measures of CAPE are around 50x today! If you believe in full reversion of both valuations and margins,then your return outlook would be exceptionally downbeat.”
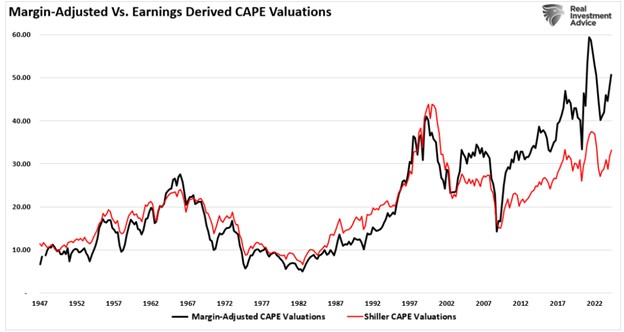
Of course, if we get valuation mean reversion, investors will face long-run returns significantly worse than 3% on an inflation-adjusted basis.
What would cause such a reversion? Any action that increases Government savings. As governments worldwide grapple with inflation and rising debt burdens, austerity measures may come into play. Consider the U.S. budget discussions around reducing expenditures on social programs and infrastructure. Any significant cuts could reduce aggregate demand, impacting corporate revenues.
Household savings trends are another factor to watch. As inflation erodes purchasing power and consumers face higher borrowing costs, the impulse to save rather than spend intensifies. This behavior can create a feedback loop in economic downturns, as lower consumption hits businesses, leading to reduced hiring and investment, further dampening growth.
Remember, in the Kalecki framework, rising household savings represent a direct drag on profits.
Why Stock Market Investors Should Be Concerned
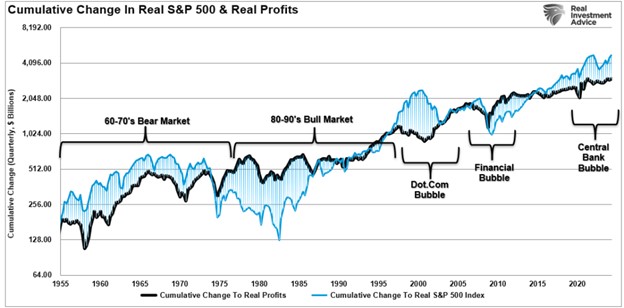
The Kalecki Profit Equation clearly explains that while debts and deficits erode economic growth and are deflationary through the diversion of capital from productive investment, a reversal of deficit spending suggests risk for investors. Valuations are high, partly because investors assume elevated profit margins will persist. However, the cumulative change of the inflation-adjusted price of the market significantly exceeds the profits being generated. Previous such deviations have not ended well for investors, which is what the Kalecki equation suggests.
We see the same evidence in the correlation between corporate profits to GDP ratio vs the inflation-adjusted market price.
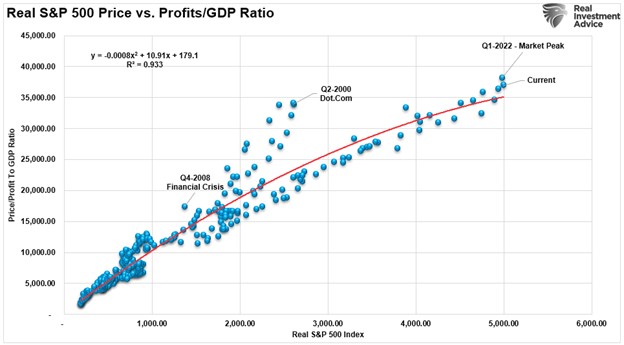
If economic conditions worsen or fiscal policies tighten, we could see a significant reset. Earnings projections would likely be revised downward, dragging down equity prices. As Montier suggests, long-term returns for U.S. equities look grim even under optimistic assumptions. He points out that price-to-earnings ratios reflect these outsized profit margins, leaving little room for error.
Importantly, as opposed to Yardeni’s more ebullient forecasts, as we addressed last week, history suggests that periods of high profitability are not indefinite. From a macroeconomic perspective, unsustainably high margins eventually face downward pressure from mean reversion. The Shiller P/E ratio, which adjusts earnings to a 10-year average, remains elevated, implying rich valuations without much margin of safety. In other words, any move toward fiscal restraint or consumer belt-tightening could usher in a profit decline.
As always, the future of corporate profits and market performance remains unpredictable, but understanding the forces at play provides an edge. Acknowledging the interdependency of government policy, household behavior, and corporate actions is crucial for investors. The coming years may test the resilience of today’s profit levels, and prudent investors should prepare for a range of outcomes.
For more insights on market trends and strategic advice, visit RealInvestmentAdvice.com.
_______________
Lance Roberts is a Chief Portfolio Strategist/Economist for RIA Advisors. He is also the host of “The Lance Roberts Podcast” and Chief Editor of the “Real Investment Advice” website and author of “Real Investment Daily” blog and “Real Investment Report“. Follow Lance on Facebook, Twitter, Linked-In and YouTube.